Holding out the metrics and data insights for business owners.
Advisory

Focus your clients on the metrics that matter with the Performance Center in QuickBooks Online Advanced

Editor’s note: Accountants can now view the Performance Center for all of their QuickBooks® Online clients. Only clients using QuickBooks Online Advanced can access the Performance Center directly.

By this time, we hope you’ve tried the latest QuickBooks Online Advanced features, including Custom Roles, Custom Fields, and Workflows. These are just the beginning of the advancements that will be made in QuickBooks Online Advanced, designed to serve the growing companies whose financial and operational needs are becoming more complex.

These companies can align well with the 220,000 businesses that are considered mid-market in the United States, whose annual revenues are $500,000 to $20 million. Intuit® is making a serious commitment to helping these mid-market businesses understand how they are doing and how they can remain successful.

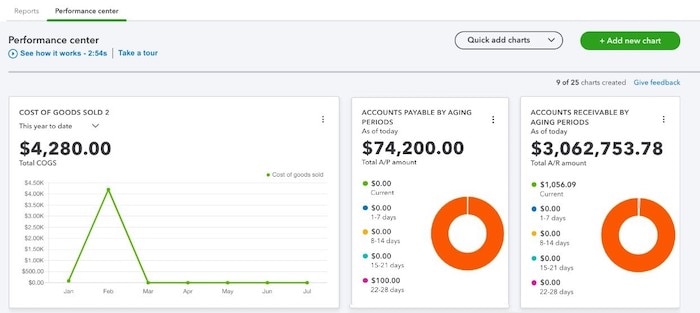
Introducing the Performance Center

First, let’s discuss the value of performance. What is business performance, and how do you best visualize this performance? It’s rather simple to understand: business performance reporting is viewing how an organization is progressing. When you add certain comparative components and summaries to performance, you begin to see things you’ve never seen before. That’s what the QuickBooks Online Performance Center does – comparing data and summarizing key financial information to transform you and your clients’ understanding of data.

Why are comparisons and summaries important? A human can only perceive a certain amount of information at any one time, and when it comes to financial information, the ability to take in large blocks of information is further limited by its complexity, or by a client’s inability to read financial information. To aid our clients in perceiving their business’ performance more accurately, accounting advisors help their clients compare and summarize:

  • Comparing gives a business owner context as to what they’re looking at. It’s important for the accounting advisor to compare one period to another period, this year to the prior year, or your company’s performance to a similar group of companies in your same industry. This context allows us to make sense of the data in ways that are more actionable.
  • Summarizing complex financial data is a way to allow the financial information to make more sense to business owners. Entrepreneurs are in their business for the fulfillment of the service or product they provide to the market. Thus, they’re typically not skilled at reading complex financial information. So, the wise accounting advisor summarizes financial data for their client, knowing that the most actionable data will fall out of the summary. The principle is that the most actionable data is not found in the details. Rather, the details are in the overall context of the summary that makes the full financial picture of the organization make sense to the business owner.

Complexity always makes it harder to see the results of performance. That’s why Intuit’s® Comparisons and Summaries – found in the Performance Center – are key to your client’s awareness of their next steps to take to transform their organization.

Businessman reviewing client advisory services on his laptop.

Free eBook

Grow Your Firm With Client Advisory Services

Fuel client growth, increase revenue, and support your customers with CAS.

How to use Performance Center

To find the Performance Center, go to Reports > Performance Center. The Performance Center comes pre-built with charts and widgets that create comparisons and summaries. To get started, you can watch a three-minute how-to video made by the QuickBooks team, and then take an hour to play around with the charts and widgets, checking out the enhancements and awareness you can bring to your client’s financial data. The charts are generated for your client automatically in QuickBooks Online Advanced, but you’ll want to adjust them to make the most sense of the data.

To see how to build your own chart inside QuickBooks Online Advance, watch the video below:

Here are a few reports we like to make immediately, when putting a client on QuickBooks Online Advanced:

  • Add the prior year/period trendline comparison period to any displayed financial data. I like to use the Trend Line chart option for financial data over time, such as revenue, profit, and cost of goods sold. As mentioned earlier, this comparison brings a wealth of knowledge and context to make more sense of the widgets. To me, the most helpful comparisons are “This year” compared to the prior period of the same year. Put similar periods side by side to see the context.
  • Note that the New Cash Flow widget is automatically displayed on the Performance Center (if you want, tweak it to compare it to the prior period for the same time frame). Viewing how cash flow changes over time is an incredible way to learn about the performance of a business on QuickBooks Online Advanced.
  • Click on the charts to see how they are displayed. Play around with the data by editing the widgets. Add comparisons, take them off, and change how they are displayed. This is how you learn about the value of their display, and how to best help your client use them. As you click around, you’ll notice that in the chart itself, you can click or unclick items in the legend. It “pops” content on and off of the face of the chart, thereby making the comparison of that data even more useful, as it appears and disappears when you are in meetings with clients and showing them the Performance Center.
  • After you’ve played around with the charts in the Performance Center, make an appointment to show this new tool to your client. Walk them through adding some comparisons, and talk to them about the value of comparisons and summaries. Charts and comparative widgets are good for displaying complex financial content in understandable ways, but it’s the accounting advisor who asks, “Why did your cash dip so low in that month?” or “How did you increase your sales by such a high percentage, as compared to last year?” These are the questions that help your clients understand their world more clearly. They begin to understand what you already know: displaying financial data in these ways is meant to lead us to answers, and then actions. Therein lies the value.

To give your clients better insight into how they are performing against their peers, Intuit has also released industry benchmarks. Industry benchmarks let you compare your clients’ gross and net profit margin to their business peers. By setting their industry in the Performance Center, QuickBooks will aggregate data from at least 30 similar businesses in a similar location and revenue range. This data is updated on a monthly basis, so that you can see how they’ve been trending and set goals to reach over time.

Let us know how you are using the Performance Center, and what tips and tricks you’ve discovered as you’ve shared it with your clients.


Get the latest to your inbox

Get the latest product updates and certification news to help you grow your practice.

By clicking “Submit,” you agree to permit Intuit to contact you regarding QuickBooks and have read and acknowledge our Privacy Statement.

Thanks for subscribing.

Relevant resources to help start, run, and grow your business.

Looking for something else?

Get QuickBooks

Smart features made for your business. We've got you covered.

Tax Pro Center

Expert advice and resources for today’s accounting professionals.

QuickBooks Support

Get help with QuickBooks. Find articles, video tutorials, and more.

How can we help?
Talk to sales 1-800-497-1712

Monday - Friday, 5 AM to 6 PM PT

Get product support