A person is looking at a laptop computer.
Advisory

QuickBooks can do WHAT? Project profitability

Many accounting pros have told us that it can be challenging to communicate with clients about the overall financial status of their business. It’s incredibly time consuming to boil down hundreds of rows of data into a report that is easy to understand, and more importantly, act upon. We know this often means sifting through information and manipulating data in a spreadsheet to present key insights about the business. And, only then, if you have time, can you guide your client toward decisions that will impact their overall success.


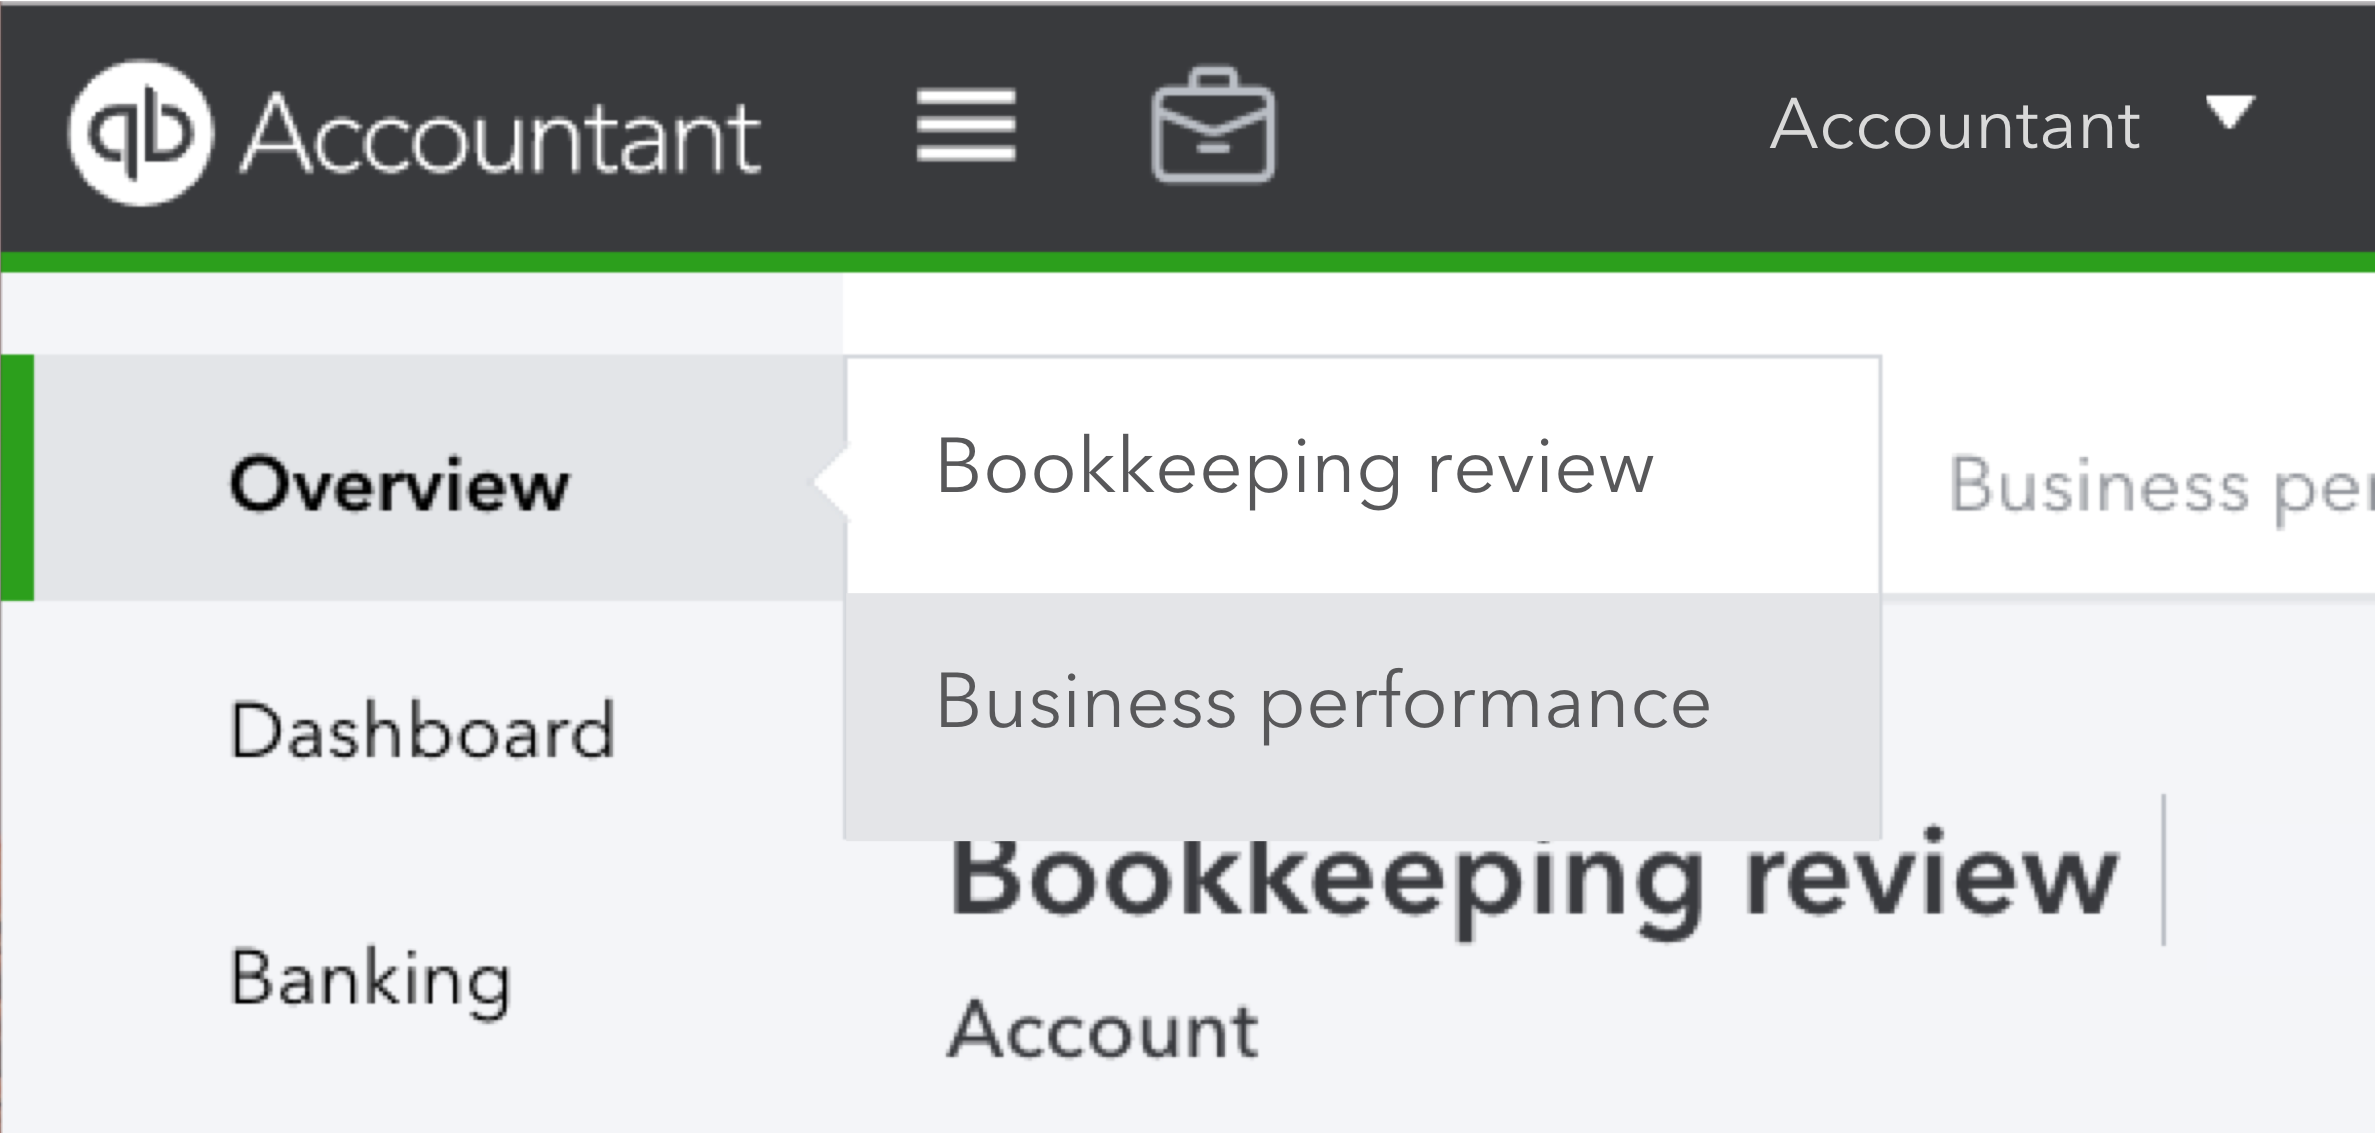
Only half of small businesses survive their first five years, but with you by their sides, their odds of success double. Your input can be transformative. QuickBooks® is investing in ways to help you have an even stronger influence on business outcomes, which is why we are excited to include introduce the Business Performance Dashboard, with the addition of industry benchmarks as part of your QuickBooks® Online Accountant ProAdvisor® benefits.


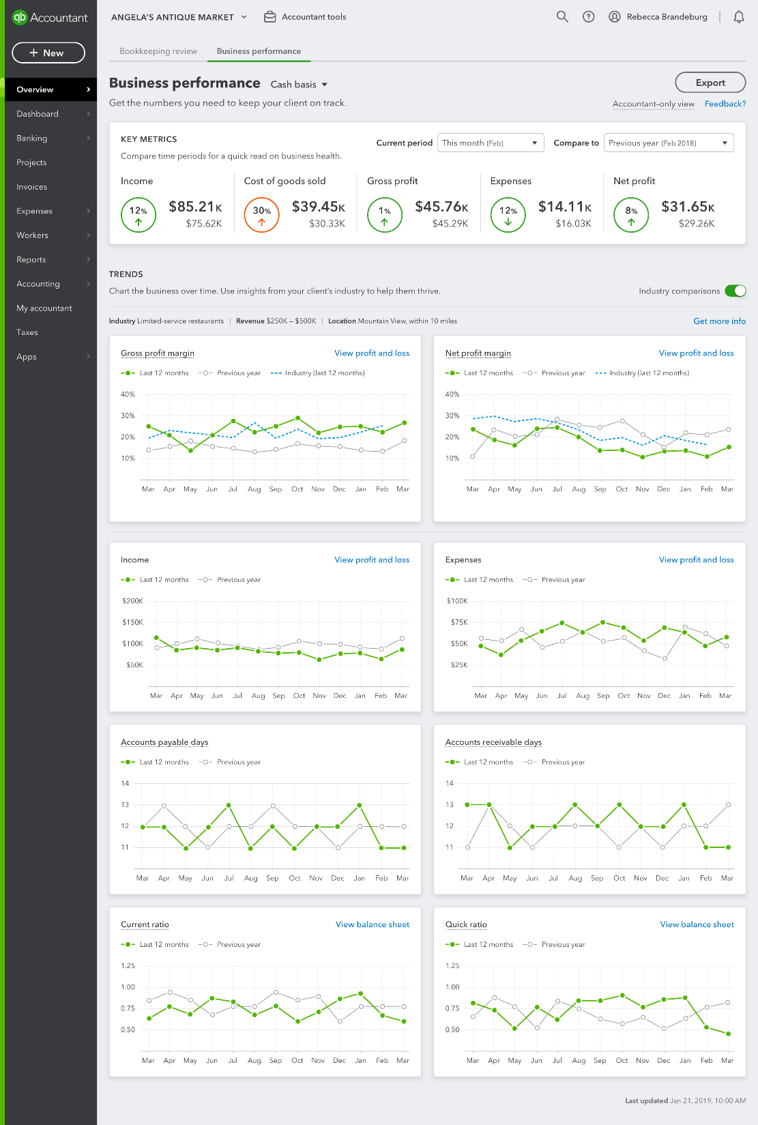
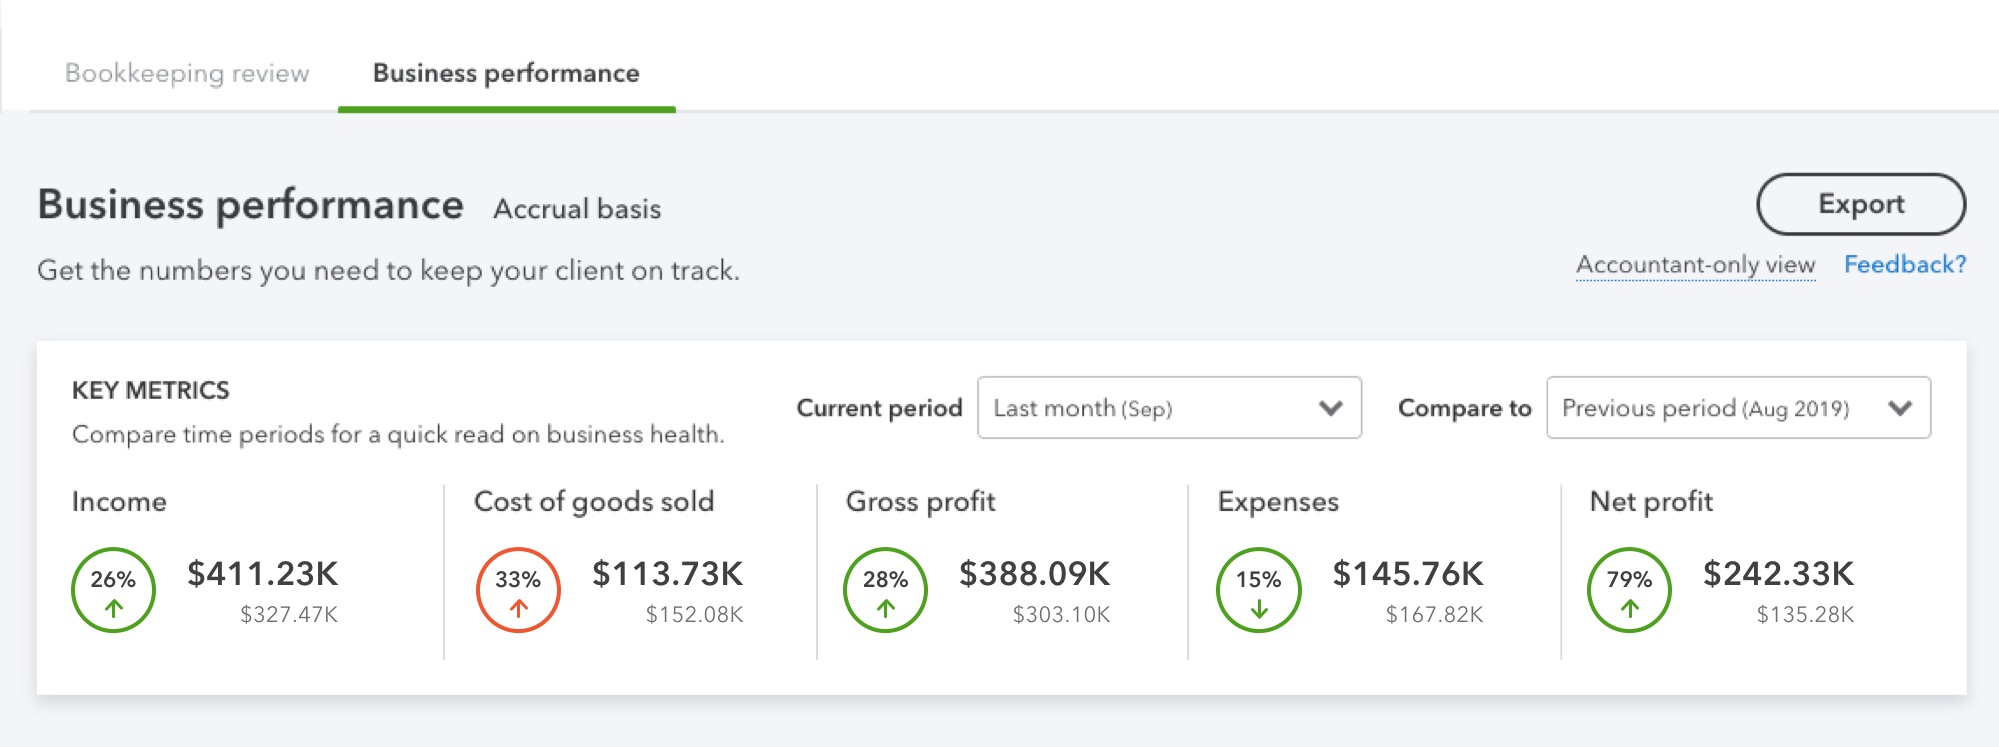
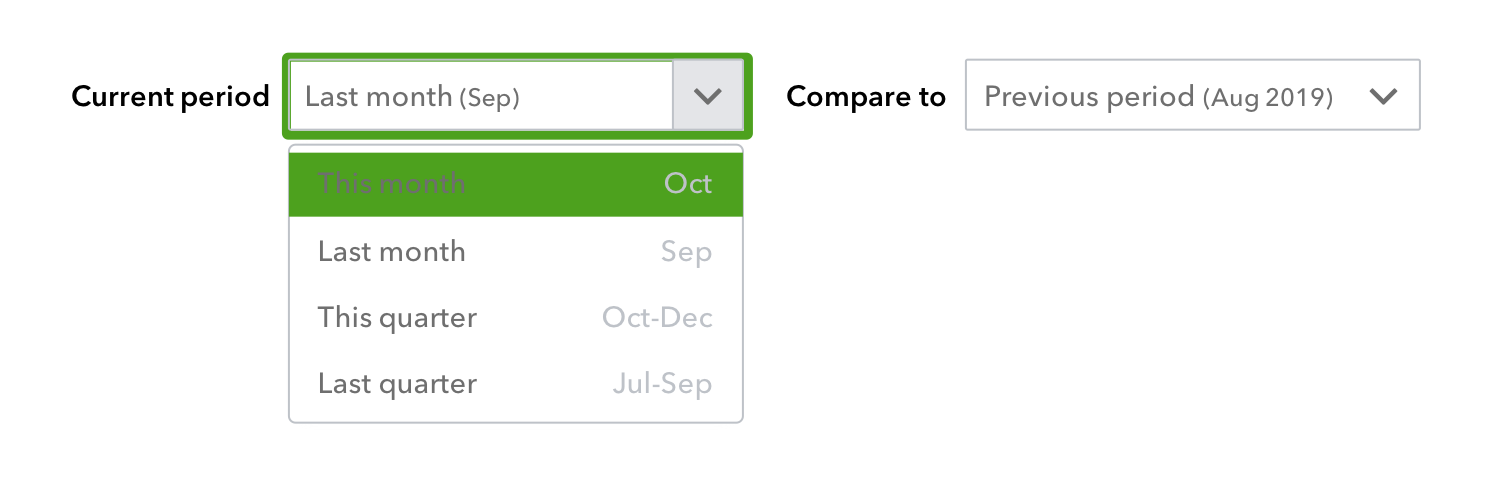
Business performance is only available through QuickBooks Online Accountant to spark conversation and strategic recommendations between you and your clients. It analyzes your client’s data and pulls out just what you need — key figures, useful indicators, actionable items, and more — organizing it into one, simple, visually-driven dashboard.


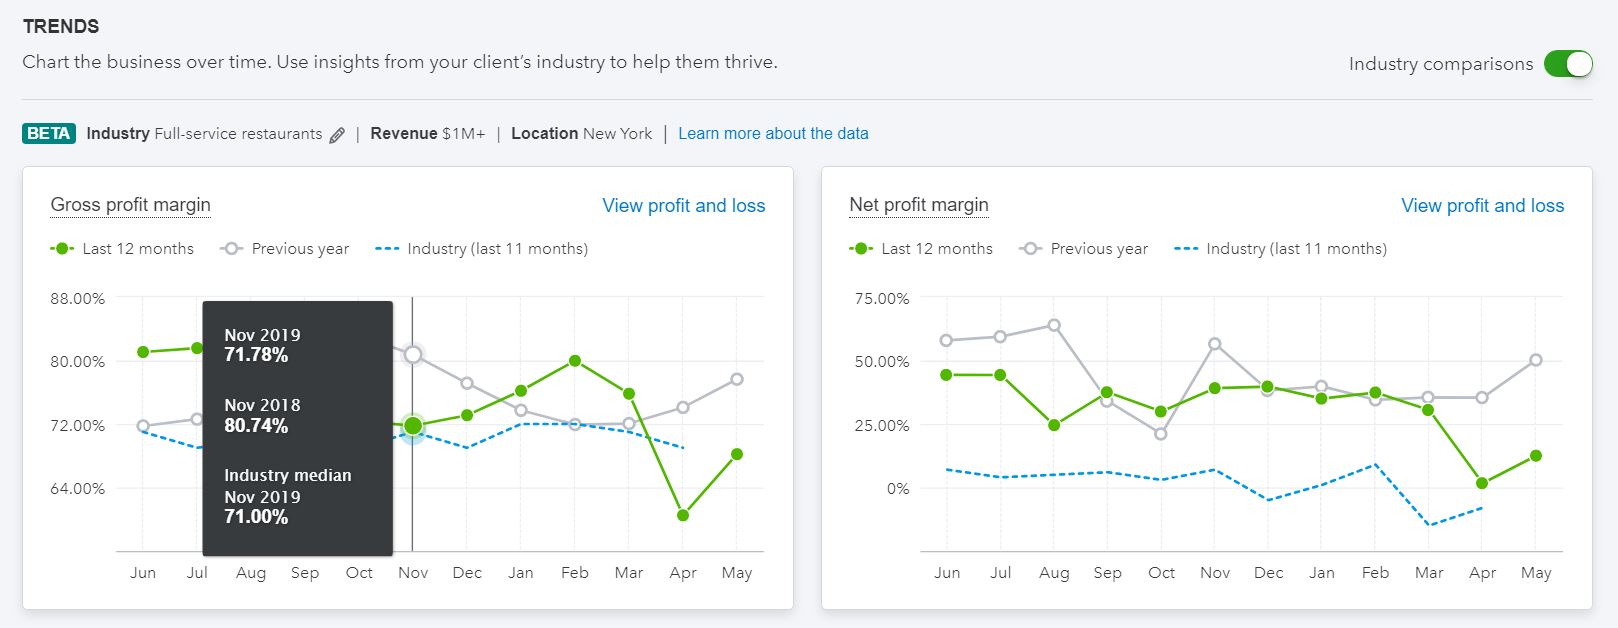
With the addition of industry benchmarks, you can now bring expert-level industry insights to client advisory, enabling you to better identify areas for business improvement and set smarter goals. Using the power of aggregated, anonymized QuickBooks data, you can compare your clients’ business performance to similar businesses in their industry, in the same location and with similar revenue. What’s more, you can easily export the report to share with a client.


What can it do?


Where do I find it?


How do I use it?


Tips and Tricks

What can it do?


Business performance calculates key ratios, provides metrics, and visualizes your client’s financial performance, automatically. The formulas and charts are created for you right inside QuickBooks, giving you the crucial data needed to have more influential discussions with your clients that will help them grow and become more profitable.


More important than what the new Business performance tool can do is what it it equips you to do. You can start by reviewing the historical metrics and trends to establish a baseline. Then, industry benchmarks lets you dive deeper by comparing your clients’ gross and net profit margin to similar businesses in their industry in the same location and with similar revenue, to identify problems and opportunities, as well as focus and improve your clients’ business outcomes. Together, you can set goals with your client and circle back each period to see how they’re progressing towards those goals, as well as compare their performance vs their peers over that same time.

The Key Metrics section displays five key performance metrics that every business should be watching to maximize profitability:


  • Income
  • Cost of goods sold
  • Gross profit
  • Expenses
  • Net profit

The Trends section has eight visual graphs that show the changes in various key metrics and ratios over time and include:


  • Gross profit margin
  • Net profit margin
  • Income
  • Expenses
  • Accounts payable days
  • Accounts receivable days
  • Current ratio
  • Quick ratio

Each graph shows monthly data from the last 12 months compared to the previous year, along with a link to view the underlying report that contains the data for each calculation. The simplicity of the charts makes it easy to visualize a company’s business cycle and identify opportunities for investment and growth. The new overview also indicates when a company may need to watch spending and conserve cash to get through leaner months.


Business performance gives you the tools you need to up your game and power prosperity with your clients through your expertise and guidance.

Businessman reviewing client advisory services on his laptop.

Free eBook

Grow Your Firm With Client Advisory Services

Fuel client growth, increase revenue, and support your customers with CAS.

Where do I find it?

When you log into a client’s company through QuickBooks Online Accountant, the Overview tab will appear at the top of the sidebar menu. Hover over the tab to see the secondary menu and select Business performance.

Menu > Overview > Business performance

Alternatively, you can access the dashboard by selecting the Business performance tab from the main Overview page. You’ll find Business performance in all the QuickBooks Online Simple Start, Essentials, and Plus companies in your client list. Plus, Business Performance is now available for your own firm! Find it in the Overview tab in the Your Books section of QuickBooks Online Accountant (industry benchmarks not yet available for your own firm).

How do I use it?

When it comes to client meetings, business performance is the perfect starting point for reviewing historical performance and crafting future goals. Take some time to explore and figure out which metrics and growth comparisons are most important for your client. Following the steps below will take you sequentially through each section, but you can always go straight to the metric(s) that matters most based on your desired objectives.


Step 1: View Key Metrics


Get a top-level overview for the health of a business’ finances and growth.

TIP: If a metric’s growth has improved relative to the previous period, the circle will appear green. If it has declined, the circle will appear orange.


Step 2: Compare Growth Periods


Measure performance against the previous month, quarter, and year.

TIP: Use the two dropdowns on the right to select the time interval and comparison. Selecting a “Current period” may change the available options in the “Compare to” option. 


Step 3: Track Developing Trends


Use trends to see how your client’s metrics have changed over the past 12 months. The charts let you easily spot patterns and gain insights about the business.


To compare the current year’s numbers to the year before, select Previous year above each chart.


Step 3A: Compare your client’s performance to peers in their industry


In the Trends section, you can also compare your client’s gross profit margin and net profit margin to other businesses in their industry over the past 12 months.

To show the industry data:


  1. Switch on the Industry comparisons button at the top right of the Trends section.
  2. If you haven’t specified your client’s industry yet, QuickBooks prompts you to select one. To change it at any time, select the Edit icon ✎ next to Industry. If you’re not sure which industry to pick, visit the North American Industry Classification System (NAICS) site for ideas.
  3. To update your client’s business location, go to your client’s QuickBooks and edit their company settings.

QuickBooks calculates the industry data based on businesses with similar revenue in your client’s geographical area.


Note: Industry comparisons don’t appear if QuickBooks doesn’t have enough data yet for your client’s industry and location. Check again periodically as we gather more data.


TIP: Click a dot on a chart’s legend to add or remove it from view. Hover over a data point to see its exact value or percentage.


Step 4: Share a performance report


Want to share what you see in the dashboard with your client? You can easily export a performance report:


  1. Set up the dashboard just the way you want it. The report will reflect your current selections. For example, select the time periods you want to compare in the Key metrics section.
  2. Select the Export button at the top right of the screen.
  3. A PDF version of the report downloads to your computer.

Tips and tricks

  1. If a Trend chart title has a dotted blue line beneath it, you can hover over it to learn how QuickBooks calculates that metric. This gives you a quick way to diagnose issues or isolate individual opportunities for growth.
  2. For a more detailed breakdown of the data contained in a specific Trend chart, click “View profit and loss” in the top right. You can also access this information through the Reports tab in the sidebar menu (Reports > Business overview > Profit and loss).

This is just the beginning of our journey to leverage the power of QuickBooks to amplify your role as your clients’ most trusted advisor. Stay tuned to Firm of the Future for more.


Editor’s note: This article was updated with new information on June 5, 2020.


Get the latest to your inbox

Get the latest product updates and certification news to help you grow your practice.

By clicking “Submit,” you agree to permit Intuit to contact you regarding QuickBooks and have read and acknowledge our Privacy Statement.

Thanks for subscribing.

Relevant resources to help start, run, and grow your business.

Looking for something else?

Get QuickBooks

Smart features made for your business. We've got you covered.

Tax Pro Center

Expert advice and resources for today’s accounting professionals.

QuickBooks Support

Get help with QuickBooks. Find articles, video tutorials, and more.

How can we help?
Talk to sales 1-800-497-1712

Monday - Friday, 5 AM to 6 PM PT

Get product support