Custom reports in QuickBooks
accounting

You can do WHAT in QuickBooks? Customizing Reports

In my role at Intuit®, I frequently hear feedback on ways we can make our products even better. I LOVE when I am able to say, “Guess what? You can do that in QuickBooks® Online (QBO) today!”

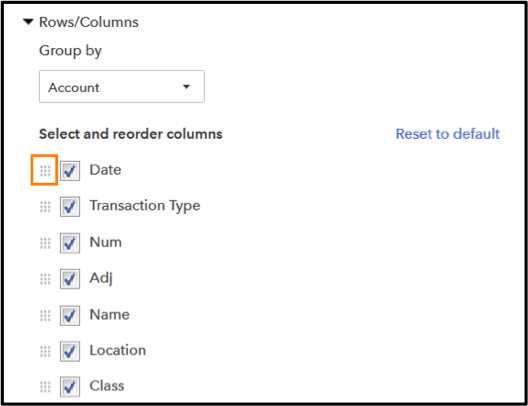
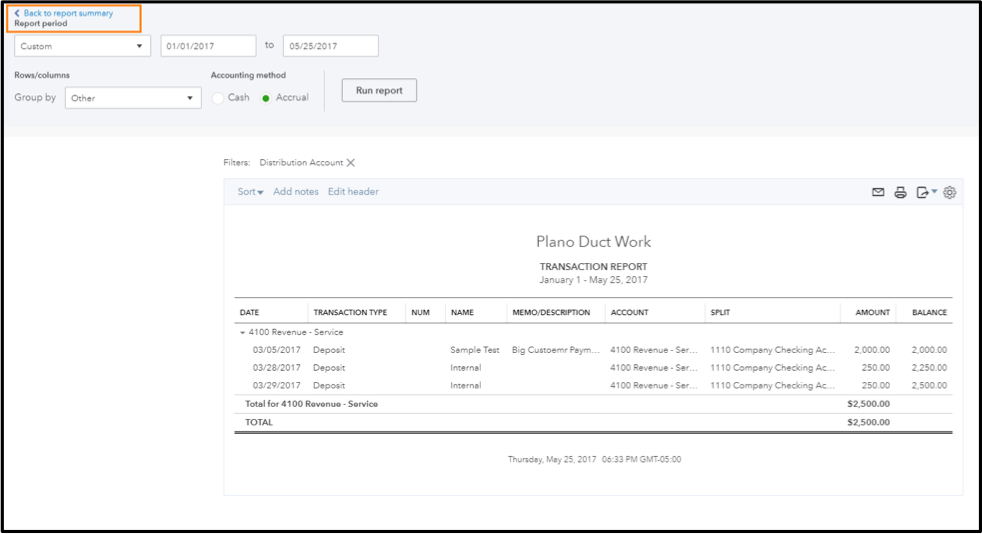
Many questions and comments revolve around customizing reports in QBO, and I often find that it’s just a matter of learning where the option is to configure the report, especially for long-time QuickBooks Desktop users. Here are a few things you may not know you can do in QBO to easily customize, save and share reports.

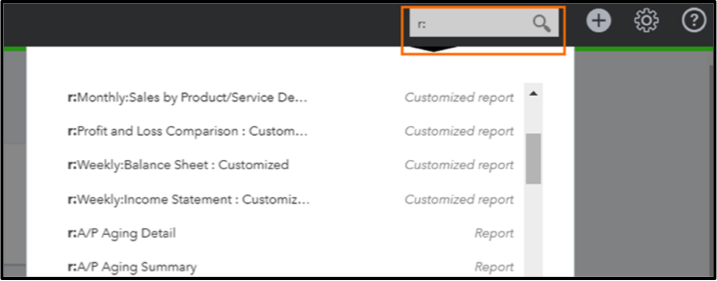
Before we get started, did you know that accountant users can quickly search for, and run, a report using QBO’s search? Start typing name of a report and QBO will filter any matching results, including any custom reports you have saved. It’s a quick way to jump straight to the report you want. You can also type “r:” to scroll through a list of all reports available in the client’s file!

If you have questions on which reports are available in the three tiers of QBO, here’s a Knowledge Base article.

Customization options vary based on the report you run. We surface common preferences along the top of each report to make it easier to customize quickly, such as choosing your report period or switching between cash/accrual basis. Always click Run Report to reflect your changes.

Along the top of the report, you can click Collapse/ Expand to collapse or expand your subaccounts, click Sort to arrange rows in ascending or descending order, and click the company name or report title to make changes to the Header.

Click Customize in the upper right to see the full options for the report, which will open in the drawer. There are several sections you can expand, depending on the report:

General

In addition to being able to change the reporting period and accounting method, you are also able to configure how numbers are displayed. 

You can change the number format to divide by 1,000, display without cents and/or except zero amount. You can change the display of negative numbers to be -100, (100) or 100-.

Check the box to show negative numbers in red.

Rows/Columns

The section has options for period comparisons, grouping or changing columns, depending on the report you run.

Generally speaking, Summary Reports (such as a Profit and Loss or Balance Sheet) will allow you to:

  • Show columns by a specified category, such as Total, or Month or Class.
  • Show sub columns for comparison, such as YTD for each row.
  • Show rows or columns of active data, all data or non-zero data.

For example, on a Profit and Loss, I may want to show columns by Location with % of Income sub-columns, in order to compare my clients’ various offices.

When viewing Detail Reports (such as a Sales by Customer Detail), you will find an option to change columns. From here, you can:

  • Check/uncheck which columns to show on the report.
  • Drag and drop to change the column order by holding down the icon to the left of the checkbox and dragging your cursor up or down.

Aging

Aging reports will have an additional section to customize aging method, days per period, number of periods and minimum days past due, if desired.

Filter

Here, you’ll find options to narrow the data displayed on the report. These options can be the key to building the most valuable reports for your clients. Some of the filtering options available are:

  • Transaction type (including posting and non-posting transactions)
  • Account
  • Distribution account
  • Name
  • Customer
  • Vendor
  • Employee
  • Product/Service
  • Location
  • Class
  • Payment Method
  • Terms

Depending on the report, you may see additional options, including custom fields.

QuickBooks Online supports up to three custom fields for sales forms, and some reports will offer the option to match exact criteria for these fields. For instance, my client is using a custom field named “Photographer” to track which team member performed the work. I can filter a Sales by Customer Detail report to see transactions where “Leah” was entered.

Header/Footer

Lastly, I can select a variety of options for the header and footer. 

Remember, click Run Report to update and reflect your selections and changes. If you print, export to Excel or PDF, or email your reports, your customizations will stay in place. You’ll be able to choose between Portrait and Landscape on the preview screen.

Tip: Once you customize a report, be sure to use “Back to Report Summary” when you drill down to view transaction details. Using the back arrow on your browser may reset the customizations you’ve made!

Click Save Customizations to add the report to your My Custom Reports list. When saving, you’ll have options to give your custom report a name, add it to a group if desired and/or share with all users with access to this client.

Groups will be specific to you as a user, even if you choose to share the report itself with others.

In the My Custom Reports list, you can run your reports, export to PDF, change your sharing settings and view reports others have shared with you.

Additionally, you can schedule a single report, or group of reports, to email automatically on a recurring schedule. This is one of my favorite lesser-known features of QuickBooks Online!

I hope this helps you as you work with reports in QuickBooks Online! 


Get the latest to your inbox

Get the latest product updates and certification news to help you grow your practice.

By clicking “Submit,” you agree to permit Intuit to contact you regarding QuickBooks and have read and acknowledge our Privacy Statement.

Thanks for subscribing.

Relevant resources to help start, run, and grow your business.

Looking for something else?

Get QuickBooks

Smart features made for your business. We've got you covered.

Tax Pro Center

Expert advice and resources for today’s accounting professionals.

QuickBooks Support

Get help with QuickBooks. Find articles, video tutorials, and more.

How can we help?
Talk to sales 1-800-497-1712

Monday - Friday, 5 AM to 6 PM PT

Get product support